Data Science / Economics Project
Understanding the Effects of Hurricane Katrina on Businesses in Louisiana
|| Christian Siauwijaya | 25 May 2023 ||
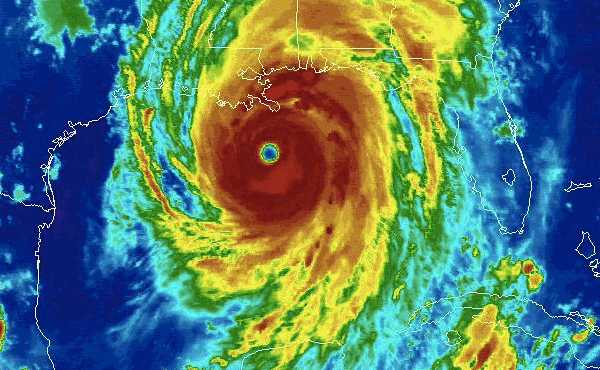
Hurricanes, Typhoons, and Cyclones have become a rallying call to address climate change since Hurricane Katrina in 2005 became one of the most destructive and expensive storms in history. The devastating Category 5 hurricane barrelled towards Louisiana on 29 August 2005, leaving behind a death toll of 1,392 people and 125 billion USD in economic damages (Knabb et al., 2023). The hurricane was its first in the millennium, one among many more devastating natural disasters that would shape the 21st century.

Figure 1. Hurricane Katrina’s landfall in Louisiana (Source: NOAA via Wikimedia)
Hurricane Katrina was one of a kind. The storm was born a tropical depression over the Bahamas on 23 August 2005 during the El Niño season, associated with warm and rainy months along the coasts of Northern Peru and Ecuador. The El Niño season creates a prime condition for tropical storms to form as cold winds merge with the warm ocean, which Kafatos et al. (2006) argue is why Hurricane Katrina formed.
Atmospheric scientists such as Kafatos et al. (2006) blamed the sea surface temperature anomaly in the Gulf of Mexico as the reason why Hurricane Katrina was so powerful. NASA (2020) argues that “the Earth’s atmosphere and oceans have warmed significantly, creating the perfect cauldron for brewing tempests”. Quoting NASA (2020) again, “While there are not necessarily more hurricanes than before, those that form appear to be getting stronger, with more Category 4 and 5 events”.
The Political Economy Research Institute at the University of Massachusetts Amherst reported 100 top polluting corporations. Among them are energy companies producing hundreds of millions of CO2 in 2020, which would take 1 billion tree seedlings to process into oxygen for 10 years, according to the EPA calculator. Top polluting corporations seem unaware of the impact of climate change on businesses as it continues to invest in polluting ventures. Therefore, understanding the effects of anomalous weather events on businesses, such as Katrina, is essential for raising awareness of the dangers of uncontrollable climate change.
This economics and data science project will revisit Hurricane Katrina’s disaster in 2005 to analyse its impact on business dynamics in Louisiana. The project aims to measure the damage done by the hurricane and answer the following questions:
1. How destructive was Hurricane Katrina on businesses?
2. Would being hit by the hurricane be detrimental to business in the long run?
3. Could businesses located in coastal counties suffer more than those inland?

Figure 2. Hurricane Katrina’s track from the Bahamas (Source: weather.gov)
Data
Using Business Dynamics Survey (BDS) data from the US Census Bureau, the Author will take the annual measure of business exit and job destruction rate from 1978 to 2020. The BDS provide data at the state and county level allowing the measurement of damage done to businesses and employment while comparing the coastal and non-coastal counties. The Author will analyse these data using Python with Pandas, NumPy and STATA integration. Readers can access snippets of the Jupyter Notebook below or through Author's GitHub projects page.
Analysis
!!! Message to mobile users !!!
Please open the Jupyter Notebook or view the desktop site to read the Python codes
Data Cleaning
Referring to the data codebook, cty signifies the county geocoding where each number represents a county in the state. Those with codes '999' and '998' are classified as 'statewide' and 'unclassified', which are irrelevant for this analysis. One can also notice the cells filled with '(D)' to signify empty data. Moreover, Historical records show that the Hurricane first made landfall in Louisiana before heading north to Mississippi. Reports show that counties in the Hurricane's path suffer the most damage along with the surrounding coastal counties. Therefore, the Author will take those '999' and '998' county codes out of the dataset, treat the empty data as 0 and restrict the dataset to Louisiana (state code '22', see: BDS codebook) for the study.
The Author is interested in measuring the impact of Hurricane Katrina on business exits and job destruction rates in the counties of Louisiana. As outlined in the introduction, the dataset will be restricted to only include the estabs_exit_rate and job_destruction_rate along with the year and cty of Louisiana (cty == 22).
Data types of the variables of interest are still classified as objects. One needs to convert these variables into floats to accommodate the decimals in estabs_exit_rate and job_destruction_rate before conducting statistical analysis with the data.

Figure 3. New Orleans Flooded After the Hurricane (Source: NASA)
After cleaning the dataset for statistical analysis, the Author will descriptively analyse the data before investigating the impact of Hurricane Katrina on counties affected by the hurricane, as visualised by Figures 1, 2 and 3.
Descriptive Statistics
Comparing the before and after, the Hurricane's damage to businesses will be statistically analysed.
Before the Hurricane

Figure 4. Business establishments and job destruction rate histogram (2004)
After the Hurricane

Figure 5. Business establishments and job destruction rate histogram (2006)
The business exits, and job destruction rates are normally distributed before the Hurricane with a 9% and 14% average, respectively. On the other hand, Louisiana's business exit and job destruction rates are positively skewed with a long tail towards the right end of the histogram.
The positively skewed histogram displays a large disparity between the counties of Louisiana after the Hurricane. A disparity in business exits and job destruction rates after the disaster signifies that some counties suffer from the disaster while others are not. The Author will investigate this disparity between the counties using a geographic heatmap to visualise the damage done by the Hurricane.
Heatmap Analysis
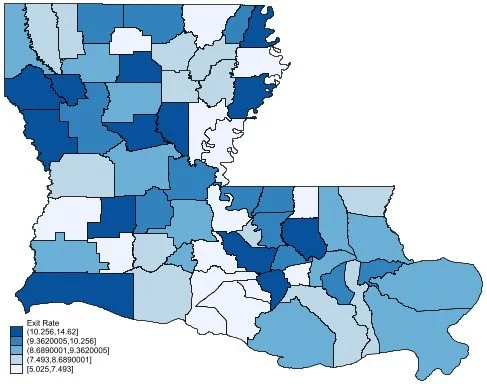
Illustrating the difference between counties before and after the disaster, the Author will display a geographic heatmap by matching the county codes using GIS data with STATA. GIS data for the following map are taken from the USGS National Boundary Dataset, which is available as a shape (.shp) file (GU_CountyOfEquivalent.shp, renamed to louisiana.shp in the Author's GitHub).
To analyse the data with STATA using Python, the data analyst will need to install the stata_setup library with the ”pip install --upgrade --user stata_setup“ command as provided by the pystata documentation. However, running this program requires one to own an original STATA 17 license.
Convert the .shp data to STATA .dta
Prepare the shape data for merger with the bdsEstabs2004 and bdsEstabs2006 dataframe
According to the codebook, the state and county number codes follow a coding system similar to the FIPS used by the USGS National Boundary Dataset. Knowing this information, the Author will merge the bdsEstabs2004 and bdsEstabs2006 datasets with the shp file using FIPS county codes as the key.
Merge the bdsEstabs2004 dataset with the shape file
Display the 2004 business establishment exit rate in Louisiana on a geographical heatmap
Display the 2004 job destruction rate in Louisiana on a geographical heatmap
Following the same method, the 2006 business establishment exit and job destruction rate will be displayed on a geographical heatmap using STATA.
Merge the bdsEstabs2006 dataset with the shape file
Display the 2006 business establishment exit rate in Louisiana on a geographical heatmap
Display the 2006 job destruction rate in Louisiana on a geographical heatmap
BEFORE
AFTER

Figure 6. Business establishments exit rate before (2004) and after (2006) Hurricane Katrina
BEFORE

AFTER

Figure 7. Job destruction rate before (2004) and after (2006) Hurricane Katrina
The figures above show a clear difference between the exit rate of businesses and job destruction before and after the Hurricane. The geographic heatmap analysis confirms the hypothesis that disparity between coastal and non-coastal counties exists after the disaster. However, comparing two timeframes alone would not be sufficient to understand the long-term effect of being hit by a destructive hurricane. Therefore, the difference-in-difference regression (DID) technique will be used to compare the coastal and non-coastal counties as they are prone to be affected by the Hurricane.
Difference-in-Difference Analysis

Figure 8. Louisiana FIPS county codes (Source: weather.gov)
Coastal Counties Model
The NOAA did Wave Forecasting Model in 2014, showing that Hurricane Katrina could create devastating waves as high as 15.4m (50.5ft). Two sea buoys capsized, and sea dykes in coastal Louisiana were breached due to the destructive powers of the waves. New Orleans was hit the worst, with 80% of the city and surrounding area remaining flooded after the hurricane. New Orleans suffered because most of the city was already below sea level. However, the effects of the hurricane on business dynamics remain unclear when comparing the coastal counties with those inland. Investigating the impact of Hurricane Katrina, the Author will perform a DID analysis by exploiting the cty geocodes to compare the business exits and job destruction rates in coastal and non-coastal counties.
Referring to Figure 8, the Author selects 14 counties directly bordering the Gulf of Mexico and names them the 'treatment' group. Those 14 counties are: Cameron(23), Vermilion(13), Iberia(45), St Mary(101), Terrebonne(109), Lafourche(57), Jefferson(51), Plaquemines(75), St Bernard(87), Orleans(71), St Charles(89), St John the Baptist(95), Tangipahoa(105), and St Tammany(103).
Preparing STATA to perform the DID regression
Difference-in-difference regression comparing coastal and non-coastal counties

Figure 9. Hurricane Katrina's effect on business exit rate (Coastal)
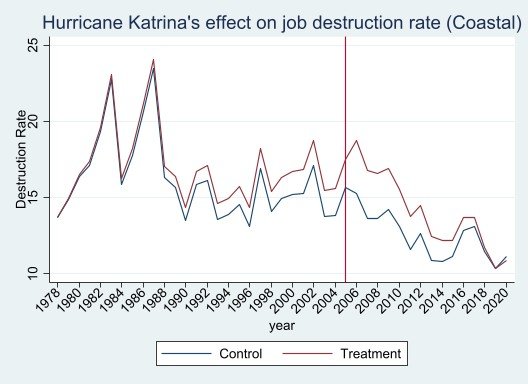
Figure 10. Hurricane Katrina's effect on job destruction rate (Coastal)
The DID analysis shows that businesses located in coastal counties (maroon line) are significantly affected by the Hurricane, as demonstrated by the stark difference between the treatment (maroon line) with the control (blue line). The regression result shows that the exit rate of businesses in coastal and non-coastal counties was alike before being disturbed by Hurricane Katrina, which increased business exits in the coastal counties of Louisiana. Statistical regression shows that destruction from the Hurricane caused a 1% increase in business exits of coastal counties, leading to a 10-year recovery period.
The Hurricane, however, does not affect the job destruction rate in coastal areas, as shown by the statistically insignificant result of the DID regression. The difference in outcomes between the business exits and job destruction rate shows that businesses in coastal counties of Louisiana were able to absorb employment despite closures due to the Hurricane. Given these results, the coastal counties model captured the job market resiliency in coastal Louisiana. What about those heavily affected by the Hurricane, as shown in Figures 6 and 7? The following 'selected counties model' will answer the question.
Selected Counties Model
Referring to Figure 4, the author selects 7 counties damaged by Hurricane Katrina the most based on the bdsEstabs2006 STATA figure and Hurricane Katrina's path shown in Figure 2 above. Those 7 counties are: Plaquemines(75), St Bernard(87), Orleans(71), St Charles(89), Jefferson(51), St Tammany(103), and Washington(117).
Preparing STATA to perform the DID regression
Difference-in-difference regression comparing counties hit by the hurricane with the others

Figure 11. Hurricane Katrina's effect on business exit rate (Coastal)

Figure 12. Hurricane Katrina's effect on job destruction rate (Coastal)
Treatment (maroon line) denotes the exit rate of businesses in the counties heavily damaged by Hurricane Katrina, while the control (blue line) denotes other counties that are not heavily damaged. The difference-in-difference analysis shows a significant difference between the control and treatment after the Hurricane with 99% statistical confidence, illustrating the detrimental effect on business exits. The same figure show that the business exit rate in the heavily damaged counties was 2% higher after the Hurricane, which only recovered 10 years after the disaster.
A similar effect was also observed for job destruction in the heavily damaged counties. The job destruction rate in these selected counties is about 2% higher than the other counties (control), with 95% statistical confidence. These DID regression results show that the Hurricane was too detrimental for businesses in counties passed by the Hurricane, which led to an increased job destruction rate after the disaster and 10 year period of recovery.
Conclusion
The economic impact of Hurricane Katrina is costly due to its detrimental effect on businesses and employment in Louisiana. The storm’s destructive force destroyed businesses and jobs, leading to increased business closures and employment losses after the disaster, exposing business vulnerabilities in hurricane-prone areas. Despite the resilience of Louisiana’s coastal community, the Hurricane’s extensive damage to businesses and employment led to a prolonged recovery in counties swept by the storm. The lessons from this catastrophic event continue to teach us how a climate change-induced disaster can affect business recovery and efforts to create economic and entrepreneurial resilience in the face of future disasters.
Keywords: Economic Analysis, Disaster Economics, Business Dynamics, Data Science, Hurricane Katrina, Difference-in-Difference Regression, Data Visualisation
Christian Siauwijaya (Project Author)

Inquiries: christiansiauwijaya@gmail.com
Tech Stack: Python, STATA, Jupyter Notebook, Pandas, Numpy, Matplotlib, Github, Jovian
Last Update: Thursday, 25 May 2023